単一細胞(シングルセル)の遺伝子発現を解析(トランスクリプトーム解析; RNA seq)の論文では、下図のような、t-SNEをプロットした図がよく登場します。
このtSNE1、tSNE2というのは一体何でしょうか?
生物学者は、細胞の種類がどれくらいあるのかを知るためのアプローチのひとつとして、個々の細胞内ではどんな遺伝子がどれくらいの量だけ発現(DNAからmRNAに転写されたり、さらにタンパク質に翻訳されたりすること)しているかを調べ、その結果に基づいてそれらの細胞を分類しようと考えます。
近年の急速な分析技術の進歩により、細胞や分子の性質を、集団の平均値としてではなく、一つひとつの細胞や分子の個性を維持したまま解析することが可能になりました。シングルセルRNA-seq解析では細胞集団の転写産物を1細胞ごとに網羅的に解析します。そのため、細胞集団を構成する細胞がどう分類できるかが未知のままでも、細胞集団を亜集団にクラスタリングして特徴を抽出することが可能です。(シングルセルRNA-seq解析 genble.com)
もし仮に細胞には遺伝子がたったの2つしかなくて、遺伝子Xと遺伝子Yの発現量を調べるだけで個々の細胞のプロファイリングができてしまうとしたら、X「軸」とY「軸」の2次元平面上にひとつひとつの細胞の遺伝子発現量をプロットすれば、細胞の種類の数だけクラスターが現れるでしょうから、目で見てわかりやすく話は簡単です。
しかしヒトの遺伝子数は2万以上もあり、実験によって多数の遺伝子に関する発現量のデータが得られます。これらのデータをそれぞれの遺伝子「軸」に関してプロットした結果(=多次元空間に分布しているデータの様子)を、平面しか認識できない人間が「見る」ことはできません。そこで、個々の細胞が発現している複数の遺伝子の量のデータ(多次元データ)を、とある数学的な処方箋(t-SNE)を用いて2次元のデータに変換(次元の削減)してしまえば、個々の細胞を(tSNE1軸とtSNE2軸からなる)2次元平面上にプロットすることができて、どのようにクラスターをつくっているのか(=どんな種類の細胞があるのか)その様子が見やすくなります。
目次
- 0.1 t-SNE(てぃー すにー)は何の略?
- 0.2 t-SNEがどんなものかをざっくり言うと?
- 0.3 t-SNEは誰がいつ考え付いたの?
- 0.4 t-SNEをもう少し詳しく説明すると?
- 0.5 次元削減の他の手法PCAなどとはどう違うの?
- 0.6 そもそもなぜ次元削減をする必要があるの?
- 0.7 遺伝子解析にはなぜPCAよりもt-SNEが適しているの?
- 0.8 t-SNEの使い方の注意は?
- 0.9 t-SNEの短所は?
- 0.10 ゲノムデータ(遺伝子発現プロファイルの解析)にt-SNEが使われるようになったのはいつ頃から?
- 0.11 どんなデータに使えるの?
- 1 t-SNEを実際に使うには?(生物学研究者向け)
t-SNE(てぃー すにー)は何の略?
t-distributed Stochastic Neighbor Embedding (t 分布型確率的近傍埋め込み)
t-SNEがどんなものかをざっくり言うと?
a new technique called “t-SNE” that visualizes high-dimensional data by giving each datapoint a location in a two or three-dimensional map. (Maaten and Hinton, 2008 PDF)
この技術は、数百または数千次元のデータですら無理やり2次元の「マップ」に落とし込むという、ほとんど魔法のような能力を備えているために、機械学習の分野で幅広く普及しています。 (高次元のデータを可視化するt-SNEの効果的な使い方 DeepAge 2017-03-8)
上記サイトではパラメータを変えたときの結果を比較していて、非常に興味深いです。
t-SNEは誰がいつ考え付いたの?
Laurens van der Maaten & GEoffrey Hinton in 2008. (PDF at Hinton lab)
下の動画では、発案者Laurens van der Maaten氏本人によるt-SNEの解説が見られます。
Visualizing Data Using t-SNE Google Tech Talk June 24, 2013 (動画55:09)
t-SNEをもう少し詳しく説明すると?
このアルゴリズムの一番の特徴は、 2 点間の「近さ」を確率分布で表現するところにあります。例えば、点 x_i とそれ以外の全ての点との距離を考えましょう。t-SNE では、基準となる点 x_i を中心とした正規分布を考え、距離を測りたい点 x_j が抽出される確率密度を、点 x_i から見た点 x_j の近さ p_{j|i} とします。これにより、x_i の近くにある点ほど p_{j|i} は大きくなり、遠くにある点ほど p_{j|i} は小さくなります。次に、次元圧縮後の点 y_i と点 y_j の「近さ」 q_{j|i} を考えます。これらは、次元圧縮前の点 x_i と点 x_j に対応します。こちらも同様に確率分布で表現するのですが、次元圧縮後の近さは正規分布ではなく自由度 1 の t 分布で考えるところがミソです。(t-SNE を用いた次元圧縮方法のご紹介 ALBERT Official Blog 2015年12月2日)
(上記サイトでは、PCAとt-SNEとを画像データに適用した結果を図示しており、t-SNEのパワフルさが一目でわかります。Rのコードあり。)
次元削減の他の手法PCAなどとはどう違うの?
Most researchers are already familiar with another dimensionality reduction algorithm, Principle Components Analysis (PCA) also available in R2 and explained in more detail in the Principle Components Analysis tutorial. Both PCA and t-SNE reduce the dimension while maintaining the structure of high dimensional data, however, PCA can only capture linear structures. t-SNE on the other hand captures both linear and non-linear relations and preserves local distances in high dimensions while reducing the information to 2 dimensions (an XY plot). (16. t-SNE: high dimensionality reduction in R2 How to find groups in your dataset using t-SNE. r2-tutorials.readthedocs.io)
そもそもなぜ次元削減をする必要があるの?
Computers have no problem processing that many dimensions. However, we humans are limited to three dimensions. Computers still need us (thankfully), so we often need ways to effectively visualize high-dimensional data before handing it over to the computer. (An illustrated introduction to the t-SNE algorithm By Cyrille Rossant March 3, 2015)
(上記サイトはヴィジュアルに非常にわかりやすくt-SNEの説明をしています)
遺伝子解析にはなぜPCAよりもt-SNEが適しているの?
First, although PCA minimizes global reconstruction error, it may not preserve local proximities of points. In visualizing gene expression data, we are typically more interested in resolving nearby clusters than in preserving the correct distance relationships between genes with very different patterns of expression. But the optimization criterion of PCA results in the opposite priority: the relationship of distant points is depicted as accurately as possible, while small inter-point distances can be distorted. Second, there may be no single linear projection that gives a good view of the data: in such a case, all linear projection methods will fail. (An intuitive graphical visualization technique for the interrogation of transcriptome data. Bushati et al., 2011. Nucleic Acids Research Volume 39, Issue 17,Pages 7380–7389)
t-SNEの使い方の注意は?
Following are a few common fallacies to avoid while interpreting the results of t-SNE:
- For the algorithm to execute properly, the perplexity should be smaller than the number of points. Also, the suggested perplexity is in the range of (5 to 50)
- Sometimes, different runs with same hyper parameters may produce different results.
- …
(Comprehensive Guide on t-SNE algorithm with implementation in R & Python
SAURABH.JAJU2, JANUARY 22, 2017)
t-SNEの短所は?
t-SNE has three potential weaknesses: (1) it is unclear how t-SNE performs on general dimensionality reduction tasks, (2) the relatively local nature of t-SNE makes it sensitive to the curse of the intrinsic dimensionality of the data, and (3) t-SNE is not guaranteed to converge to a global optimum of its cost function. (Maaten and Hinton, 2008 PDF)
ゲノムデータ(遺伝子発現プロファイルの解析)にt-SNEが使われるようになったのはいつ頃から?
自分が調べた限り、下記の論文よりも古い論文が見つかりませんでした。
Here, we test the recently developed nonlinear dimensionality reduction algorithm, t -statistic Stochastic Neighbor Embedding ( t -SNE) ( 8 ), on a variety of real-world transcriptome data sets. (An intuitive graphical visualization technique for the interrogation of transcriptome data. Nucleic Acids Res. 2011 Sep 1;39(17):7380-9.
We tested seven DRTs applied to four microarray cancer datasets and ran four clustering algorithms using the original and reduced datasets. … On the other hand, t-distributed Stochastic Embedding (t-SNE) and Laplacian Eigenmaps (LE) achieved good results for all datasets. (Comparative study on dimension reduction techniques for cluster analysis of microarray data. Date of Conference: 31 July-5 Aug. 2011 ieeexplore.ieee.org)
どんなデータに使えるの?
Question: why PCA for RNA-Seq but tSNE for scRNA-seq? (biostars.org)
Question: What to use: PCA or tSNE dimension reduction in DESeq2 analysis? (support.bioconductor.org)
t-SNEを実際に使うには?(生物学研究者向け)
Rを用いてt-SNE
A step-by-step workflow for low-level analysis of single-cell RNA-seq data with Bioconductor (bioconductor.org)
A step-by-step workflow for low-level analysis of single-cell RNA-seq data Aaron T.L. Lun, et al. F1000Research Software tool article
The Rtsne module in Array Studio will allow the user to cluster different cells with UMI counts, using the Rtsne package in R (arrayserver.com)
MATLABでt-SNE
t-SNE とは t-SNE (
tsne) は、高次元データの可視化に適している次元削減アルゴリズムです。名前は、t-distributed Stochastic Neighbor Embedding (t 分布型確率的近傍埋め込み) を表します。考え方は、点の間の類似度が反映されるように高次元の点を低次元に埋め込む、というものです。高次元空間の近接点は低次元に埋め込まれた近接点に対応し、高次元空間の遠隔点は低次元に埋め込まれた遠隔点に対応します (一般に、高次元空間と低次元空間で正確に距離を一致させることは不可能です)。関数tsneは、高次元データから低次元の点の集合を作成します。通常は、低次元の点を可視化して、元の高次元データにおける自然なクラスターを調べます。(Mathworks)
シングルセルRNA-seq解析の実際
Introduction to single-cell RNA-seq (hemberg-lab.github.io)
Seurat is an R package designed for QC, analysis, and exploration of single cell RNA-seq data. Seurat aims to enable users to identify and interpret sources of heterogeneity from single cell transcriptomic measurements, and to integrate diverse types of single cell data. (satijalab.org)
Identifying and Characterizing Subpopulations Using Single Cell RNA-seq Data (hms-dbmi.github.io)
シングルセルRNA-seqガイド
A practical guide to single-cell RNA-sequencing for biomedical research and clinical applications (Haque et al., Genome Med. 2017; 9: 75)
RNA-Seq 実験 sequencing depth の決め方 (bioinformatics 2017.06.10)
Design and Analysis of Single-Cell Sequencing Experiments. Grün et al., 2015 Cell Volume 163, Issue 4, 5 November 2015, Pages 799-810
Comparative Analysis of Single-Cell RNA Sequencing Methods. Ziegenhain et al., Molecular Cell 65, 631–643, February 16, 2017 (PDF)
t-SNEを説明した動画(一般)
t-SNE tutorial Part1 Divy Kangeyan 2017/05/26 に公開 (動画12:28)
参考
- t-SNE explained in plain javascript Nick Strayer· observablehsq.com Feb 6, 2018
- t-SNEによるイケてる次元圧縮&可視化 Qiita 2017年12月14日に投稿
- 【多様体学習】LLEとちょっとT-SNE hellocybernetics.tech
- t-SNEの結果をplotlyで3D可視化する MATHGRAM
- scikit-learnでt-SNE散布図を描いてみる ももいろテクノロジー
- https://www.rna-seqblog.com/tag/t-sne/
- https://www.ncbi.nlm.nih.gov/pmc/articles/PMC5845381/
- http://journals.plos.org/plosgenetics/article?id=10.1371/journal.pgen.1006599
参考(シングルセルRNA SEQデータの解析方法いろいろ)
- Visualization and analysis of single-cell RNA-seq data by kernel-based similarity learning. Bo Wang, Junjie Zhu, Emma Pierson, Daniele Ramazzotti & Serafim Batzoglou
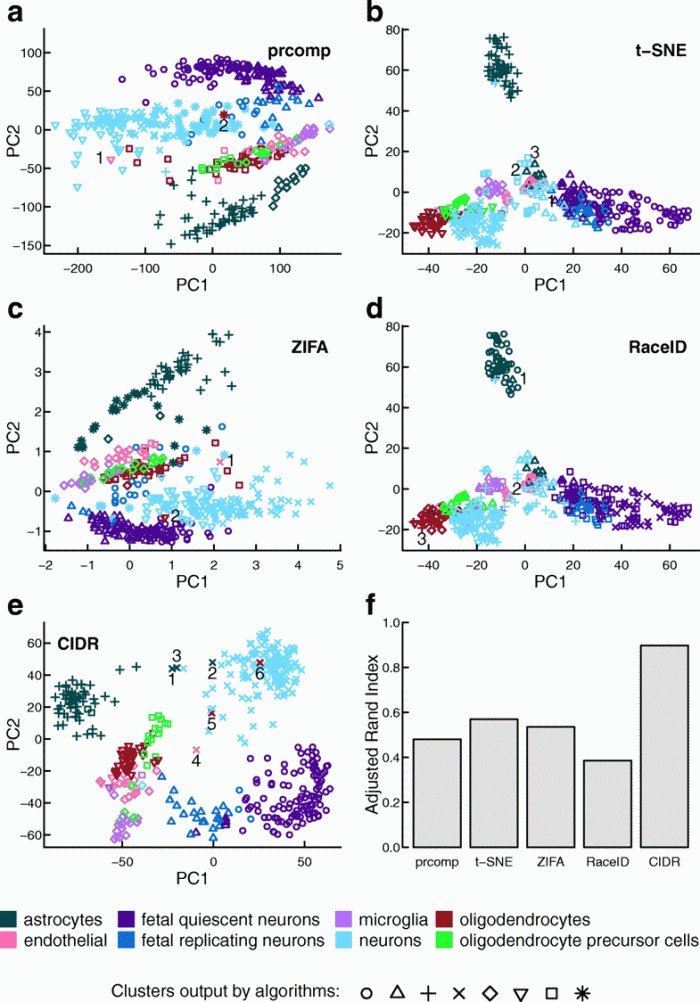
Nature Methods volume 14, pages 414–416 (2017) 新手法の提案 We present single-cell interpretation via multikernel learning (SIMLR), an analytic framework and software which learns a similarity measure from single-cell RNA-seq data in order to perform dimension reduction, clustering and visualization. 既存の手法との比較 On seven published data sets, we benchmark SIMLR against state-of-the-art methods. - CIDR: Ultrafast and accurate clustering through imputation for single-cell RNA-seq data. Lin P, Troup M, Ho JW. Genome Biol. 2017 Mar 28;18(1):59. 新手法の提案 Most existing dimensionality reduction and clustering packages for single-cell RNA-seq (scRNA-seq) data deal with dropouts by heavy modeling and computational machinery. Here, we introduce CIDR (Clustering through Imputation and Dimensionality Reduction), an ultrafast algorithm that uses a novel yet very simple implicit imputation approach to alleviate the impact of dropouts in scRNA-seq data in a principled manner. 従来の手法t-SNEなどとの比較 Using a range of simulated and real data, we show that CIDR improves the standard principal component analysis and outperforms the state-of-the-art methods, namely t-SNE, ZIFA, and RaceID, in terms of clustering accuracy. 代表的な結果の図
- Visualization and cellular hierarchy inference of single-cell data using SPADE. Anchang B, Hart TD, Bendall SC, Qiu P, Bjornson Z, Linderman M, Nolan GP, Plevritis SK. Nat Protoc. 2016 Jul;11(7):1264-79. 新たなデータ可視化手法の提案 we describe the use of Spanning-tree Progression Analysis of Density-normalized Events (SPADE), a density-based algorithm for visualizing single-cell data and enabling cellular hierarchy inference among subpopulations of similar cells. 別のデータ可視化手法であるt-SNEとの比較 We compare SPADE with recently developed single-cell visualization approaches based on the t-distribution stochastic neighborhood embedding (t-SNE) algorithm.

参考(t-SNEを用いた論文)
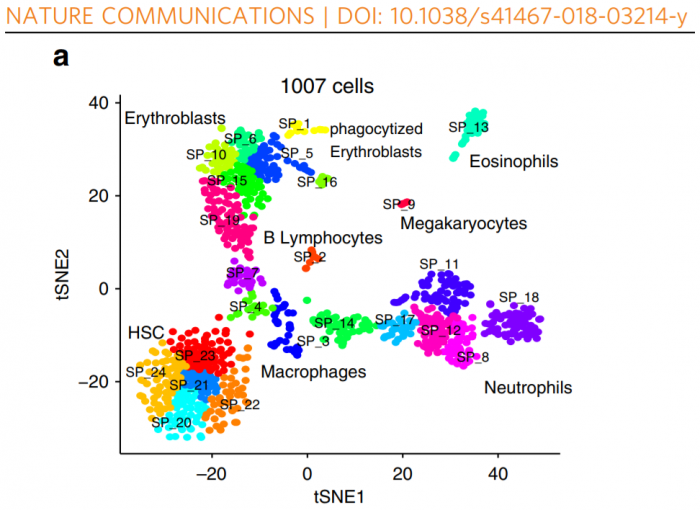
- Single-Cell RNA-Seq Reveals Hypothalamic Cell Diversity. Chen et al., 2017. Cell Reports Volume 18, Issue 13, p3227–3241
- SAIC: an iterative clustering approach for analysis of single cell RNA-seq data. Yang L, Liu J, Lu Q, Riggs AD, Wu X. BMC Genomics. 2017 Oct 3;18(Suppl 6):689. 解析の重要性 An important step in the single–cell transcriptome analysis is to identify distinct cell groups that have different gene expression patterns. 従来の手法の問題点 Many studies rely on principal component analysis (PCA) with arbitrary parameters to identify the genes that will be used to cluster the single cells. 新手法の提案 We have developed a novel algorithm, called SAIC (Single cell Analysis via Iterative Clustering), that identifies the optimal set of signature genes to separate single cells into distinct groups. データ可視化のステップでのt-SNEの利用 We applied the SAIC algorithm to one simulated dataset and two published single cell datasets. After signature genes selection, the results were evaluated by Davies-Bouldins index and then visualized using both a t-SNE 2D–plot and an unsupervised hierarchical clustering heatmap.
シングルセル解析二関連する製品(機器、試薬キット、解析ソフトウェアなど)
- Illumina 1細胞分離からデータ解析まで必要なものが1つにddSEQ™ Single-Cell Isolator とSureCell™ WTA 3′ Library Prep Kit により実現
- BD Rhapsody シングルセル解析システム 数万のシングルセルに対し数百の遺伝子を同時解析
- In the study (“Single-Cell RNA-Seq of Rheumatoid Arthritis Synovial Tissue Using Low-Cost Microfluidic Instrumentation”), published in Nature Communications, the researchers describe the 3D-printed custom device, which, along with its electronic and pneumatic components, can be obtained and assembled for a total cost of about $600. The device occupies a small footprint as well, not much larger than a tissue box. (genengnews.com)
- シングルセル解析は、1細胞レベルでmRNA解析を行うことで、細胞集団の平均的な解析ではなく、個々の細胞の変化を動的に追い、システマチックな理解へ繋げることが可能になる技術です。… 取得した配列データを参照ゲノム配列へマッピングし、適切なソフトウェアを用いて遺伝子発現定量解析を行います。得られた発現プロファイルにアノテーション情報を付与し、各種統計解析を行います。解析結果は、遺伝子の発現量をまとめたファイル、主成分分析(PCA)結果、t-SNE解析などをまとめて納品いたします。(シングルセルレベルでの遺伝子発現解析 ICELL8™ シングルセル解析 takara-bio.co.jp )
生命科学の他の分野におけるt-SNEの利用
人や動物の行動学の解析においてもt-SNEが用いられています。
- Comprehensive machine learning analysis of Hydra behavior reveals a stable basal behavioral repertoire. Han et al., 2018. eLife. 2018; 7: e32605.
- 【行動認識 #9】t-SNEをtensorboard(Embedding Visualization)で可視化 MotoJapan’s Tech-Memo 2017-09-04
- Automatic classification of behavior in zebrafish larvae. Jouary and Sumbre. bioRxiv May 10,2016
- Mapping the stereotyped behaviour of freely moving fruit flies. Berman et al., 2014. Journal of the Royal Society Interface