当ウェブサイトは以前、「日本の科学を考えるガチ議論」の記事『捏造問題にもっと怒りを』のコメント欄に匿名A氏が書き込んだ84報を紹介しました。このコメント欄に、類似画像を含む論文等総計111報がリストアップされていたので転載します。新たな論文を指摘するものではなく、匿名A氏がこれまでに2chや『捏造問題にもっと怒りを』のコメント欄で指摘してきた論文の総まとめだそうです。
#1 Nature. 1998 Jan 1;391(6662):96-9.
Fig 1a. Lane 1 is similar to Lane 5. Lane 6 is similar to Lane 10.
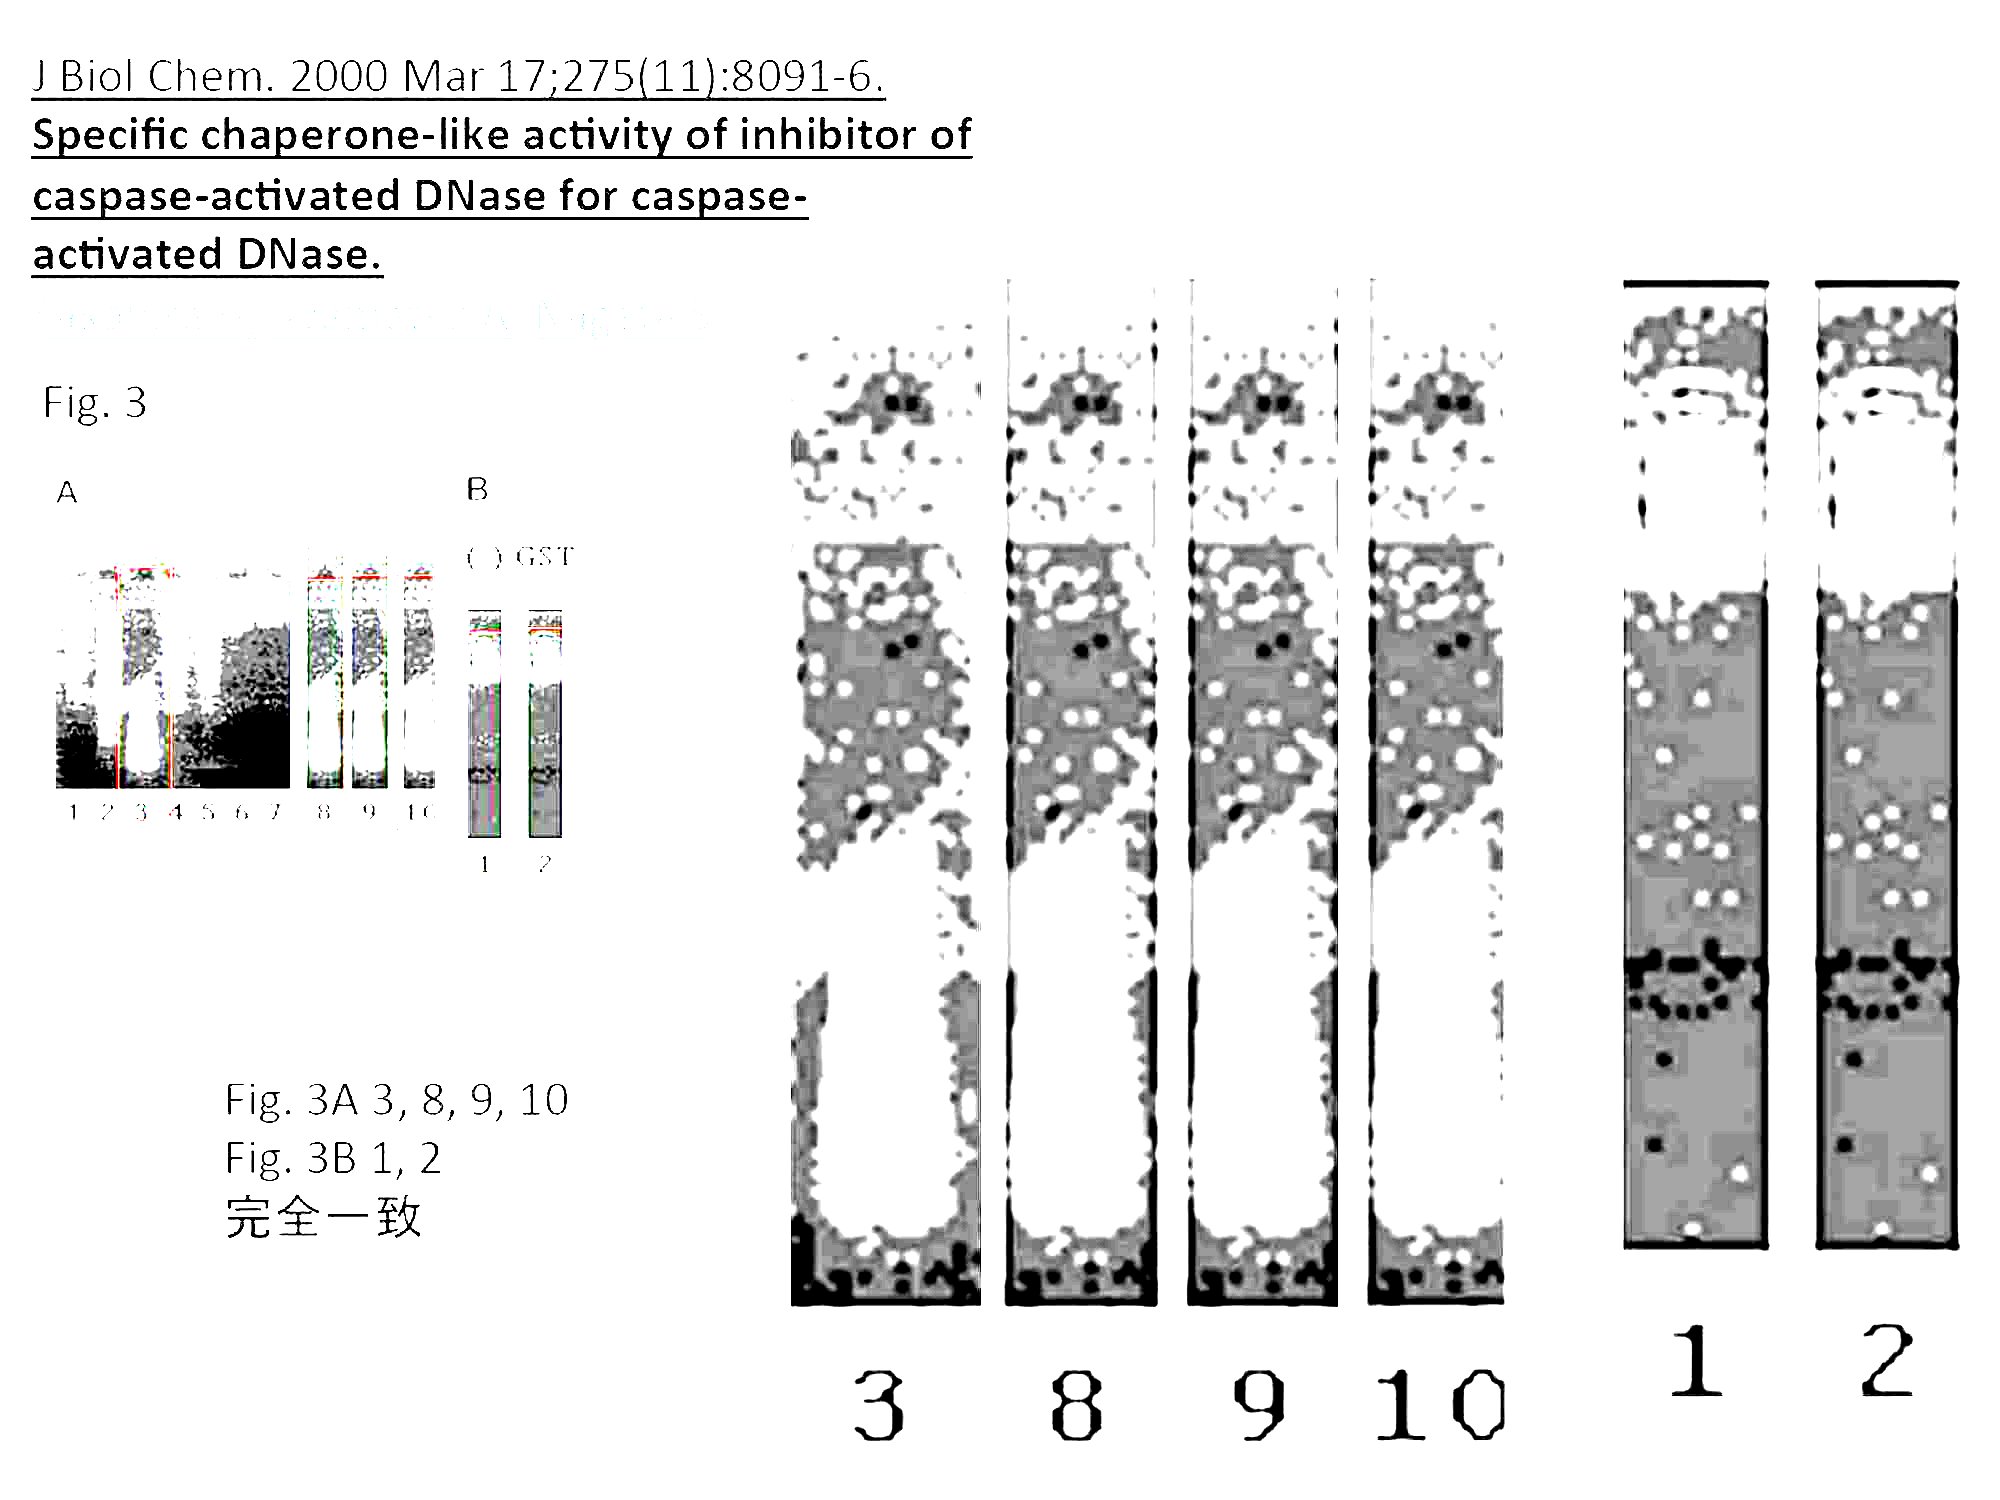
#2 J Biol Chem. 2000 Mar 17;275(11):8091-6.
Fig 3A. Lane 3 is similar to Lane 8, 9, and 10. Fig 3B. Lane 1 is similar to Lane 2.
#3 Arch Biochem Biophys. 2001 Apr 1;388(1):91-9.
Fig 2A. Lanes 2-3 are similar to lanes 9-10. Fig 4B. Lanes 2-3 are similar to lanes 9-10.
#4 Diabetes. 2002 Oct;51(10):2915-21.
Fig 5. 18S of B is similar to that of C (horizontal flip).
#5 Nat Med. 2002 Jul;8(7):731-7. Epub 2002 Jun 17.
Fig 1b. +/- is partially similar to -/-. Fig 2. 18S of a is similar to that of b. Fig 5a. 28s of TNF-alpha(-) and Adiponectin(+) is similar to that of TNF-alpha(+) and Adiponectin(+).
#6 J Biol Chem. 2003 Jun 13;278(24):21344-51. Epub 2003 Apr 1.
Fig 5. Lane 2 is partially similar to lane3.
#7 Mol Cell Biol. 1996 Jun;16(6):3074-84.
Fig 7C. Lane a is similar to Lane b.
#8 J Biol Chem. 2001 Nov 2;276(44):41245-54. Epub 2001 Aug 31.
Fig 4G. PIPs are similar to those of Fig. 5d in another paper (J Clin Invest. 2001 Oct;108(7):1001-13. #9 in this list.) The date of submission of this paper is later than that of #9.
#9 J Clin Invest. 2001 Oct;108(7):1001-13.
Fig 6b. The CD36 band in the lane HF is similar to the UCP2 band in the lane HF+BADGE (horizontal flip). The CD36 band in the lane HF+BADGE is similar to the UCP2 band in the lane HF+HX531 (horizontal flip).
#10 Nat Genet. 2002 Feb;30(2):221-6. Epub 2002 Jan 30.
Fig 6. 28S in a (WAT) is similar to that of in d (BAT).
#11 Biochem Biophys Res Commun. 2004 Oct 8;323(1):242-8.
Fig 2A. The control lanes are similar to the salicylate lanes. Fig 3B. p-Akt in Lane 3 is similar to that in Lane 7. p-Akt in Lane 5 is similar to that in Lane 6. Akt in Lane 4 is similar to that in Lane 6. Fig 4. Lane 5 is similar to Lane 7 (horizontal flip).
#12 J Biol Chem. 2001 Jul 20;276(29):27519-26. Epub 2001 May 24.
Fig 6. E is similar to f. Fig 9. D is similar to e and f (enlarge).
#13 Exp Cell Res. 2002 Jan 1;272(1):23-31.
Fig7. Bone marrow cells of LZP is similar to those of CRP.
#14 Oncogene. 2002 Jan 24;21(5):844-8.
Fig 1b. These figures (HUVEC and ST2 cells) are similar to those of the COS7 cells in another paper (Fig. 6 in J Biol Chem. 2001 Jul 20;276(29):27519-26. #12 in this list.)
#15 Biochem Biophys Res Commun. 2002 Apr 26;293(1):332-7.
Fig 1. The mice of 2 weeks are similar to those of 3 weeks (vertically enlarge).
#16 J Virol. 1999 Nov;73(11):9237-46.
Fig 5B. Some bands seem to be pasted in the figures. For example, lane 3 in the left SeV/mSF figure.
#17 J Virol. 2000 Jun;74(12):5619-28.
Fig 2A. In the upper figure, 4C(-) 20 is simiar to 4C(-) 26. Fig 2B. GAPDHs of Wt 14, Wt 38, 4C(-) 14, and 4C(-) 20 are similar.
#18 J Virol. 2001 Apr;75(8):3802-10.
Fig 4C. Y1+ is similar to Y2+.
#19 J Virol. 2002 Jul;76(14):7114-24.
Fig 4B. Y2.5+ is similar to Y3+.
#20 J Virol. 2004 Jul;78(14):7443-54.
Fig 5. STAT2 of None is similar to that of Cm5.
#21 J Virol. 2007 Apr;81(7):3264-71. Epub 2007 Jan 10.
Fig 4. In the most upper figure, Sev Wt 0 is similar to Sev Wt 6 in both 2fTGH STAT1(+/+) cells and U3A STAT1(-/-) cells.
#22 Biochem Biophys Res Commun. 2002 Aug 9;296(1):194-200.
Fig 3A. Lane 1 is similar to Lane2 for GluSyn.
#23 Biochem Biophys Res Commun. 2001 Nov 30;289(2):531-8.
Fig 1 and Fig 2. 18S rRNA of Lane 2 (monocytes) in Fig 1 is similar to that of Lane 2 (alpha-GalCer-imDCs) in Fig 2.
#24 Circ Res. 2004 Jun 11;94(11):1492-9. Epub 2004 Apr 29.
Fig 2 and Fig 3. E1A in the lanes 1-2 of Fig 2A is similar to that in the lanes 2-3 of Fig 3C.
#25 J Biol Chem. 2002 Apr 5;277(14):12351-8. Epub 2002 Jan 22.
Fig 1B. D is similar to g. Fig 3B. The right part of Myc-MST1 WT is similar to that of Flag-MST1 444P.
#26 J Biol Chem. 1999 Apr 23;274(17):11995-2000.
Fig 4. EDTA is similar to Fuc.
#27 J Biol Chem. 2000 Jun 9;275(23):17233-6.
Fig 2B. Input of 0-45 is similar to that of 90-180. Fig 4. ECT2-N1(-) 45 is simialr to ECT2-N1(+) 45.
#28 J Biol Chem. 2002 Dec 27;277(52):50966-72. Epub 2002 Oct 21.
Fig 2B and Fig 4C. The actin in Fig 2B is similar to that of Fig 4C (horizontally flip.) Fig 4C and Fig 5D. The six COX bands in Fig 5D is similar to six bands of actin in Fig 4C.
#29 J Biol Chem. 2001 Mar 23;276(12):9460-7. Epub 2000 Dec 19.
Fig 1B. In the lower figure, RET-2B is similar to RET-2B/LAR.
#30 J Biol Chem. 1999 Dec 31;274(53):38251-9.
Fig 2A. 37 degrees Celsius is partially similar to 30 degrees Celsius.
#31 Nucleic Acids Res. 2000 Mar 15;28(6):1355-64.
Fig 7A. 18S rRNA of placenta is similar to that of mammary gland in another paper (Fig 2A in Mol Biol Cell. 1999 May;10(5):1637-52.)
#32 DNA Repair (Amst). 2007 Jun 1;6(6):760-9. Epub 2007 Feb 5.
Fig 5A. GAPDH of W in 5 weeks is similar to that of SP in 16 weeks.
#33 J Biol Chem. 2000 Aug 18;275(33):25146-54.
Fig 6D. pMAPK of S10A is similar to that of WT-DMSO (horizontally flip). You can pay attention to the noise of the rim.
#34 J Biol Chem. 2002 Apr 26;277(17):14355-8. Epub 2002 Mar 11.
Fig 1B. Tubulin in cytoplasm is similar to that in whole cell.
#35 EMBO J. 2002 Dec 2;21(23):6312-20.
Fig 2C. p47phox is similar to p67phox.
#36 J Biol Chem. 2003 Jul 4;278(27):25234-46. Epub 2003 Apr 25.
Fig 3A. The two lower left cells are similar between wt and P156Q.
#37 J Biol Chem. 2003 Jun 20;278(25):22908-17. Epub 2003 Apr 7.
Fig 2. MRP11-116/MRP2 is similar to MRP11-1480/MRP2.
#38 J Virol. 1999 Oct;73(10):7981-7.
Fig 1A. Lane 1 is similar to Lane 3 and 6. Lane 2 is similar to Lane 8. Lane 4 is similar to Lane 7.
#39 J Biol Chem. 2002 Jan 18;277(3):2132-7. Epub 2001 Oct 22.
Fig 2b. The FLAG band of GST-WT is similar to the GST band of WT-WT. Fig 3A. The left upper figure is similar to the left lower figure (horizontally flip).
#40 J Biol Chem. 2004 Jun 11;279(24):25474-82. Epub 2004 Mar 22.
Fig 5A. Lanes 8-9 are similar to lanes 12-13.
#41 Diabetes. 2003 Nov;52(11):2657-65.
Fig 3B. APS bands in GFP lanes seem to be pasted in. IR beta bands in GFP lanes are similar to those in APS(YF) lanes.
#42 J Biol Chem. 1999 Nov 5;274(45):32309-17.
Fig 4A. Lane 1 is similar to Lane 15 (horizontally flip). Lanes 12-13 are similar to Lane 16-17 (horizontally flip).
#43 J Biol Chem. 2000 Sep 1;275(35):26856-63.
Fig 9C. Mock-transfected cell (-) is somewhat similar to Mutant probe (-). Mock-transfected cell oligo TRE is somewhat similar to Mutant probe Ang II.
#44 J Biol Chem. 2000 Feb 11;275(6):4369-73.
Fig 3. GAPDHs of Time 4, 5, and 6 are similar in PAO+. Fig 4. iNOS mRNA of Lane +-+- is similar to that of Lane +–+.
#45 Hepatology. 2000 Nov;32(5):1037-44.
Fig 3. 3h None is similar to 5h Hypo.
#46 J Hepatol. 2004 Apr;40(4):616-23.
Fig 4A. Phospho-Akt of 2h(-) is similar to that of 2h(+).
#47 Am J Physiol Endocrinol Metab. 2005 May;288(5):E876-82. Epub 2004 Dec 21.
Fig 4A. 28S and 18S in lanes 1-6 are similar to those in another paper (Fig 1A in Biochem Biophys Res Commun. 2004 May 14;317(4):1075-9.)
Fig 5A. In the adiponectin bands, Lanes 1-4 are similar to lanes 12-15. Lanes 6-7 are similar to lanes 9-10.
#48 Biochem Biophys Res Commun. 2001 Apr 27;283(1):255-9.
Fig 2. V/Vsp in lanes 1-3 is similar to V/Vsp in lanes 7-9, STAT1 in lanes 10-12, and STAT1 in lanes 13-15. IRF9 in lanes 10-12 are similar to that in lanes 13-15.
#49 J Virol. 2002 Dec;76(24):12683-90.
Fig 8. In the Blot:FLAG, FL is similar to FLMT in the two middle lanes (vertically enlarge).
#50 J Biol Chem. 2003 Oct 24;278(43):41654-60. Epub 2003 Aug 13.
Fig 4. HSF-1s of OSC19-MP(mock) C and IFN in Fig 4A, from total cell lysate, are similar to those of OSC19 cytosol C and IFN in Fig 4C. HSF-1s of OSC19-MP(STAT-1) C and IFN in Fig 4A, from total cell lysate, are similar to those of OSC19-MP cytosol C and IFN in Fig 4D.
#51 J Med Virol. 2006 Apr;78(4):417-24.
Fig 2. GAPDH of RSV 5 is similar to that of inactivated SARS 1. GAPDH of FluAV 1 is similar to that of inactivated SARS 2. Fig 5. GAPDH of RSV 5 is similar to that of inactivated SARS 1. GAPDH of FluAV 1 is similar to that of inactivated SARS 2.
#52 Cancer Lett. 1999 Jul 19;142(1):23-30.
Fig 2B. hTERT of lane D is similar to that of lane F2.
#53 Leukemia. 2000 Jul;14(7):1260-5.
Fig 1b and 3b. hTERT of Fig 1b is similar to that of Fig 3b (horizontally flip).
#54 Biochem Biophys Res Commun. 2004 Apr 2;316(2):528-32.
Fig 1. 15 N is partially similar to 30 N.
#55 Cancer Lett. 2008 Mar 18;261(2):226-34. Epub 2007 Dec 21.
Fig 1. K562/hTERT 1 is similar to K562/hTERT 10.
#56 Cancer Res. 2006 Oct 15;66(20):9913-20.
Fig 4C. ADAM28 of Day3 is similar to that of Day 31 (vertically enlarge). Fig 5C. Lane 1 is similar to Lane 4.
#57 Biochem Biophys Res Commun. 2005 Mar 25;328(4):1232-43.
Fig 2. Two exon 3 figures are similar.
#58 Biochem Biophys Res Commun. 2000 Aug 11;274(3):603-8.
Fig 5. Two right lower bands in Fig 5A are similar to two left lower bands in Fig 5B.
#59 Biochem Biophys Res Commun. 2001 May 11;283(3):707-14.
Fig 3C. In the lower figure, the left four bands are similar to the middle four bands and the right four bands.
#60 Nat Cell Biol. 1999 Dec;1(8):479-85.
Fig 4a. Western(PS) of A246E is partially similar to that of delta E9.
#61 J Biol Chem. 2001 Jan 19;276(3):2108-14. Epub 2000 Oct 12.
Fig 1. Lanes N and H in Fig 1C are similar to Fig 1D.
#62 J Biol Chem. 2001 Nov 16;276(46):43446-54. Epub 2001 Sep 10.
Fig 1a and Fig 2a. Ten actin bands of Fig 1a are similar to those of Fig 2a.
#63 J Biol Chem. 2002 Apr 12;277(15):12931-6. Epub 2002 Jan 25.
Fig 3b. PY20 of Src is similar to Lysate of Src.
#64 Circulation. 2002 Jun 18;105(24):2893-8.
Fig 2. ERK of Fig 2C is similar to that of Fig 2D (horizontally flip, change brightness and contrast).
#65 J Biol Chem. 2002 Mar 8;277(10):8076-82. Epub 2002 Jan 4.
Fig 3. Cyclin D1 and actin of 694F are somewhat different with those of delta p85.
#66 J Biol Chem. 2005 Feb 11;280(6):4929-39. Epub 2004 Nov 24.
Fig 2A. Bcl-2 and actin of ED(-) are similar to those of ED(+).
#67 J Biol Chem. 2005 Apr 1;280(13):13163-70. Epub 2005 Jan 25.
Fig 5E. The left four lanes of CHO-B are similar to the right four lanes of CHO-B.
#68 J Biol Chem. 2001 Mar 30;276(13):9688-98. Epub 2000 Dec 14.
Fig 2C. Lane +— is similar to Lane +-+-. Fig 5B. Lane 1 is similar to Lane 3.
#69 J Biol Chem. 2001 Dec 14;276(50):47642-9. Epub 2001 Oct 10.
Fig 1B. Lane 2 is similar to Lane 4 (horizontally flip). Fig 5A. ERKs of lanes 1-4 are similar to those of lanes 5-8 (horizontally flip). Fig 7A. The upper two bands of pSG5 are similar to those of ER beta (horizontally flip).
#70 J Biol Chem. 2001 Feb 2;276(5):3459-67. Epub 2000 Oct 23.
Fig 7B. pSG5 is similar to ER beta (horizontally flip).
#71 J Biol Chem. 2002 Sep 6;277(36):33490-500. Epub 2002 Jun 26.
Fig 1B. ERKs of lanes 1-3 are similar to those of lanes 4-6. Fig 3A. Lanes 1-2 of Caov-3 are similar to lanes 3-4 of Caov-3 (horizontally flip). Fig 4A. Lanes 1-2 of BAD are similar to lanes 3-4 of BAD. Fig 6B. Phospho-Raf of Lane 2 is similar to that of Lane 5.
#72 Endocrinology. 2004 Jan;145(1):49-58. Epub 2003 Sep 18.
Fig 3B. Akt of lanes 1-2 is similar to that of lanes 3-4.
#73 Clin Cancer Res. 2004 Nov 15;10(22):7645-54.
Fig 1D. Akt of lanes 1-2 is similar to that of lanes 3-4.
#74 Endocrinology. 2004 Mar;145(3):1302-13. Epub 2003 Nov 26.
Fig 8B. Lane 1 of A2780 is similar to Lane 3 of Caov-3.
#75 J Biol Chem. 2004 May 28;279(22):23477-85. Epub 2004 Mar 16.
Fig 2A. Lanes 2-4 of actin are similar to lanes 6-8 of actin (horizontally flip).
#76 J Biol Chem. 2000 Nov 10;275(45):35051-62.
Fig 7C. Lanes i, j and k of abDbf4p are somewhat similar.
#77 Proc Natl Acad Sci U S A. 2000 Dec 5;97(25):13824-9.
Fig 4A. The most upper figure of insulin is similar to that of IGF-1.
#78 J Biol Chem. 1999 Mar 26;274(13):8531-8.
Fig 5C. In the Ad5IkB lane, Bcl-2 is similar to Bcl-x (horizontally flip and vertically enlarge). In the Ad5LacZ+TNF lane, Bcl-2 is partially similar to Bcl-x (vertically enlarge).
#79 FASEB J. 2001 May;15(7):1218-20.
Fig 1A. Akt of Cont is similar to that of VEGF.
#80 Nat Med. 2001 Mar;7(3):317-23.
Fig 2a. Actin of Astrocytes is similar to that of another paper (Fig 5C in J Biol Chem. 2001 Feb 2;276(5):3046-53. Epub 2000 Oct 20.)
#81 J Biol Chem. 2003 Jan 17;278(3):2058-65. Epub 2002 Nov 7.
Fig 2. wt is similar to delta alpha 1.
#82 J Biol Chem. 2001 Sep 7;276(36):34259-69. Epub 2001 Jul 2.
Fig 7. SRE-352 is similar to SRE-344 (vertically enlarge).
#83 J Biol Chem. 2005 Mar 18;280(11):10468-77. Epub 2005 Jan 7.
Fig 5B. IB:anti-V5 of STAM1 is similar to that of STAM1-mUIM.
#84 Cancer Res. 2007 Jun 1;67(11):5162-71.
Fig 2A. The well of WT is similar to that of control.
#85 Nature. 2008 Jul 17;454(7202):345-9.
Fig. 1c. The beta-actin of the lane 1 is similar to that of the lane 2.
Fig. 3b. The beta-actin of the lane 1 is similar to that of the lane 2.
Fig. 3e. The alpha-MHCs of the lanes 1, 4, and 6 and the GATA-4 of the
lane 5 are similar.
Fig. 3e. The GATA-4 of the lane 1 is similar to that of the lane 6.
Supplementary Fig. S3e. The bands of Nkx2.5 (-) and GATA4 BP4-2 are similar.
Supplementary Fig. S3f. The bands of Nkx2.5 (-) and beta-actin (-) are
similar (resized).
#86 J Biol Chem. 2004 Mar 19;279(12):11384-91.
Fig. 3. The MLC-2v is similar to the cardiac alpha-actin.
#87 Nat Med. 2009 Sep;15(9):1082-7.
The CT scan of WT (HS/HS) of Supplemental Fig. 2c is similar to those
of Pre operation of Supplemental Fig. 2d, G4 (HS/HS) of Supplemental
Fig. 2c, and G4 Trp53+/-(HS/HS) of Supplemental Fig. 2c.
The bars of G4 (HS/HS) and G4 Trp53+/- (HS/HS) for lean tissue/BW in
the right of Supplemental Fig. 2c are identical for mean and SEM.
#88 Nat Cell Biol. 2004 Jun;6(6):499-506.
The lower right band in the Fig. 2f is similar to the right band of Fig. 2h.
The upper band in the lane 3 in Fig. 2e is similar to the band in the
lane 2 in Fig. 3e.
#89 Biochem Biophys Res Commun. 2004 Sep 10;322(1):310-9.
Fig. 2b. The 28Ss of the lane 1-3 are similar to those of the lane 4-6.
#90 J Biol Chem. 1999 Mar 19;274(12):8231-9.
TTF1 of Fig. 2b is similar to NKE2 of Fig. 2c and CSX+ GATA-4+ of Fig. 7.
#91 Biochem Biophys Res Commun. 2000 Apr 21;270(3):1074-9.
Fig. 2a. GAPDH of WT At is similar to that of TG At. GAPDHs of WT Vt,
TG Vt, and TG Sk are similar.
#92 Circulation. 1999 Nov 16;100(20):2100-7.
Fig. 3b. DM 10 min in GST-c-Jun (1-79) is similar to DM 60 min
(horizontally flip.)
#93 Circulation. 2003 Dec 16;108(24):3024-30.
Fig. 5c. The upper band in Sham TG is similar to that of I/R TG.
#94 Circulation. 1998 May 19;97(19):1952-9.
Fig. 4. 18S of the right of Wild Type Banding is similar to that of
AT1a KO Banding.
18S of the left of Wild Type Sham is similar to that of Wild Type Banding.
18S of the right of Wild Type Sham is similar to those of the both
lanes of AT1a KO and that of the left lane of ShamAT1a KO Banding.
#95 Circ Res. 1999 Mar 5;84(4):458-66.
Fig. 2. The (-) in the upper MBP is similar to D.N.Cdc42.
#96 EMBO J. 2000;19(20):5533-41.
Fig. 3a. The upper band of +/- is similar to the band of -/-. Pay
attention to that the three “+” over the figure are not identical.
Fig. 7b. The eight error bars in the right panel are similar.
#97 Hypertension. 1998 Jan;31(1):50-6.
Fig. 5. The two lanes of S(SHRSP) in 24 wk are similar.
#98 Circ Res. 1998 Oct 5;83(7):752-60.
Fig. 1c. The 5 min is similar to the 3h (horizontally flip.)
#99 J Am Soc Nephrol. 2003 Mar;14(3):584-92.
Fig. 1c. The three lanes of ERK are similar to those of p38.
#100 Hypertens Res. 2005;28(5):447-55.
Fig. 2b. Con is similar to ALD/Spi.
#101 J Pharmacol Sci. 2005;98(4):372-9.
Fig. 4. BNP is similar to MCP-1.
#102 Circulation. 2003;107(10):1411-7.
Fig. 5. The lanes 1 and 2 of alpha-tubulin are similar to the lanes 3 and 4.
#103 Hypertension. 2006; 48:628-636.
All of the pictures and graphs of Fig. 1 HT are similar to those of
Fig. 5 HT-SD for.
All of the pictures and graphs of Fig. 2 HT is similar to Fig. 7 HT-SD
for except for the ICAM Western.
The ICAM Western in Fig. 2 NT is similar to that of Fig. 7 HT-SD
(horizontally flip.)
The actin of NT in Fig. 2 is similar to that of HT-Chimera in Fig. 7.
#104 Mol Pharmacol. 2005;67(5):1666-73.
Fig. 2A p-Src is similar to Fig. 2A Ser-STAT3 and Fig. 2C Tyr-STAT3.
The left 7 lanes of Fig. 2A Src are similar to the right 7 lanes of Fig. 2C Src.
The right 7 lanes of Fig. 2A ERK are similar to the left 7 lanes of Fig. 6A ERK.
The right 7 lanes of Fig. 2A Jak2 are similar to the left 7 lanes of
Fig. 2C Jak2.
Fig. 2C p-Pyk2 is similar to Fig. 2C Pyk2.
Fig. 2C Ser-STAT1 is similar to Fig. 2C Ser-STAT3.
The right 5 lanes of Fig. 2C Ser-STAT1 are similar to the right 5
lanes of Fig. 4A siRNA-MKP-1 MKP-1 (horizontally flip.)
The left 2 lanes of Fig. 4A siRNA-Lamin A/C alpha-SM actin are similar
to the left 2 lanes of Fig. 4A siRNA-MKP-1 alpha-SM actin.
The rightest lane of Fig. 4A siRNA-Lamin A/C alpha-SM actin is similar
to that of Fig. 4A siRNA-MKP-1 alpha-SM actin.
The left 7 lanes of Fig. 4B siRNA-Lamin A/C ERK are similar to the
right 7 lanes of Fig. 4B siRNA-MKP-1 ERK.
Fig. 6A Pyk2 is similar to Fig. 6C Pyk2.
Fig. 6A Src is similar to Fig. 6A Jak2.
Fig. 6A p-ERK is similar to Fig. 6C p-ERK.
The left 4 lanes of Fig. 6A p-Tyk2 are similar to the left 4 lanes of
Fig. 6A Tyr-STAT1 and the left 4 lanes of Fig. 6C Tyr-STAT3.
The right 4 lanes of Fig. 6A Tyr-STAT1 are similar to the right 4
lanes of Fig. 6A STAT3.
The left 7 lanes of Fig. 6A Tyr-STAT3 are similar to the left 7 lanes
of Fig. 6C Tyr-STAT1.
The right 4 lanes of Fig. 6A Tyr-STAT3 are similar to the left 4 lanes
of Fig. 6A STAT3 (horizontally flip.)
Fig. 6C p-Src is similar to Fig. 6C p-Tyk2 and Fig. 6C Ser-STAT1.
Fig. 6C Src is similar to Fig. 6C Tyk2 and Fig. 6C STAT1.
Fig. 2C Src is similar to Fig. 2C STAT3 (horizontally flip.)
#105 Arterioscler Thromb Vasc. 2012 Jun;32(6):1453-9.
Fig. 5. oxLDL (-) of A is similar to oxLDL (50ug/ml) of B.
#106 Nature. 1998 Jul 2;394(6688):92-6.
Fig. 2b. -TGF-beta, M-2[Evi-1(-)] is similar to +TGF-beta, E-5[Evi-1(+)].
#107 Circulation. 2006 Aug 29;114(9):953-60.
Supplemental Fig. IV. Something wrong in DKO+Vehicle of ICAM-1.
#108 Circulation. 2002 Sep 10;106(11):1397-402.
Fig. 3. 2-c is similar to 3-c (rotate.) The experimental condition for
3-c is different between the main text and the figure legend.
#109 Circulation. 2002 Mar 12;105(10):1240-6.
The lanes 1-3 in Skeletal alpha-actin in Fig. 3a is similar to the
lanes 2-4 of Skeletal alpha-actin in Fig. 1B.
#110 Arthritis Rheum. 2000 Feb;43(2):259-69.
There are a lot of duplications in the actin of Fig. 3B.
#111 J Clin Invest. 1999; 104(2):137-146
Fig. 2a. Src. Control is similar to AxCATcsk(moi) 100 (horizontally flip.)
Fig. 4b. IL-6. Control is similar to AxCASLacZ. Actin. Control is
partially similar to AxCATcsk(moi) 100.
Fig. 6d. Csk. Ax1w1 is similar to AxCATcsk Day42.
参考
- 新参者のために私がこれまで2ちゃんねるやこのコメント欄でしてきた111報の指摘を再び紹介します。匿名Aとは何か? この指摘をした人物のことです。あとはどーでもいい低脳な話をしているだけ。全て新規指摘ではないので騒がないでください。騒いだらか恥ずかしいです。新しく科学部に配属されたマスコミの方々は、一つ一つ丁寧に調べ、私が隠した数百万人の命に関わるリスクを見つけてください。(日本の科学を考えるガチ議論 捏造問題にもっと怒りを コメント欄 匿名A)
- 酷似する画像を含む生命科学論文がインターネット上で大量に指摘される